Introduction

Nepal is celebrating year 2020 as “Tourism Year” targeting 2 million international tourist arrivals. You can learn more about the #VisitNepal2020. I want to see the trend/history of nepal tourism and extracted the data from the Wikipedia in Scraping Data with R blog post.
In this section, we will work on the scrapped data from the Scraping Data with R blog post and perform analysis, create some visualization and understand the trend of Tourism in Nepal.
Lets Start
I will load the required package for this blog.
library(ggplot2)
library(rvest)
library(dplyr)
library(tidyr)
library(purrr)
library(stringr)
library(lubridate)
library(gganimate)
library(plotly)
library(tibble)
wikipage <- read_html("https://en.wikipedia.org/wiki/Tourism_in_Nepal")table <- wikipage %>%
html_nodes("table.wikitable") %>%
html_table(header=T,fill = TRUE)
table <- table[[1]]
#add the table to a dataframe
tourist_df <- as.data.frame(table)names(tourist_df) <- c("year","tourist_number","per_change")tourist_df$tourist_number <- str_remove(tourist_df$tourist_number,",")
tourist_df$per_change <- str_remove(tourist_df$per_change, "%")
tourist_df$tourist_number <- str_remove(tourist_df$tourist_number,",")tourist_df$tourist_number <- as.integer(tourist_df$tourist_number)
tourist_df$per_change <- as.numeric(tourist_df$per_change)
tourist_df$year <- as.integer(tourist_df$year)This is the data frame which I got after the extraction and cleaning process in the last blog. Now I will create a visualization from this data using ggplot2 and plotly.
Visuals
gplot <- ggplot(tourist_df, aes(
  x = year,
  y = tourist_number, fill = tourist_number
)) +
  geom_col() +
  labs(
    y = "Number of Tourist",
    title = "Number of Tourist Arrival from 1993 to 2018"
  ) +
  scale_fill_gradient(low="#fedb81", high="red")+
  theme_minimal()
ggplotly(gplot)%>%config(displayModeBar = F)
This barplot shows the number of arrival of international tourist from 1993 to 2018. The trend of tourist number was good from 1993 to 2000. Then from 2001, the flow of the international tourist decreased as it was the period where civil war was at its height. The country was in the emergency period.
In 2015 there was an earthquake which destroyed most of the historic sites in Kathmandu valley and with large physical and human casualties. This decreased the number of tourist in Nepal. I can see that 2016 onward the number of tourists arrival increased every year. In 2018 the number of tourist arrival crossed first time 1 million.
gplot <- ggplot(tourist_df, aes(
  x = year,
  y = per_change, fill = per_change
)) +
  geom_col() +
  labs(
    y = "Percent Change of Tourist",
    title = "Percentage Change  of Tourist Arrival from 1993 to 2018"
  ) +
  scale_fill_gradient(low="#fedb81", high="red")+
  theme_minimal()
ggplotly(gplot)
This plot shows the percentage change in the flow of the tourist arrival every year.
Top 10 Country
In this section, I will find the top 10 countries with must tourist to Nepal.
This is the data I got from the last blog and now I need to extract the top 10 countries from this dataframe.
con_tour_df<- head(con_tour_df,10)This dataframe has the years in a different column. I keep all the years in year column along with there tourist arrival value.
con_tour_df <- pivot_longer(con_tour_df,-c(Country,Rank),names_to = "year")con_tour_df$year <- as.numeric(con_tour_df$year)
con_tour_df$value <- as.numeric(con_tour_df$value)Now, I need to rank the country based on the number of tourist arrival from that country. I use mutate() to create a new column “rank”.
con_tour_df <- con_tour_df%>%
  group_by(year) %>%
mutate(rank = rank(-value),Value_lbl = paste0(" ",value))%>% filter(rank <= 10) con_tour_df$value <- as.integer(con_tour_df$value)This the final data frame that I got after cleaning. Now, it is time to create some visualization/animation.
I am using the ggplot2 package to create static visualization and gganimate to create beautiful animations.
colors <- c(
  "India" = "#FF7F24", "China" = "#E31A1C", "Sri Lanka" = "#FFB90F",
  "United States" = "#4876FF","Thailand" = "#BF3EFF",
  "United Kingdom" = "#FF4040", "South Korea" = "#EE8262",
  "Germany" = "#8B7E66","Australia" = "#2E8B57", "Myanmar" = "gray",
  "Bangladesh" = "#006400","France"="#104E8B", "Japan" ="#CDB5CD"
)
In this visualization, i need 10 different colours to show a different country in the animation. I created a colour palette and named colors which will be used while creating visualization below.
anim <- ggplot(con_tour_df, aes(x = rank, y = value, group = Country)) +
  geom_bar(stat = "identity", aes(fill = Country)) +
  geom_text(aes(y = 0, label = paste(Country, " ")), vjust = 0.2, hjust = 1, size = 4.5) +
  geom_text(aes(y = value, label = Value_lbl, hjust = 0), size = 4.5) +
  scale_y_continuous(labels = scales::comma) +
  scale_x_reverse() +
  coord_flip(clip = "off", expand = FALSE) +
  scale_fill_manual(values = colors) +
  theme_minimal() +
  theme(
    axis.line = element_blank(),
    axis.text.x = element_blank(),
    axis.text.y = element_blank(),
    axis.ticks = element_blank(),
    axis.title.x = element_blank(),
    axis.title.y = element_blank(),
    legend.position = "none",
    panel.background = element_blank(),
    panel.border = element_blank(),
    panel.grid.major = element_blank(),
    panel.grid.minor = element_blank(),
    panel.grid.major.x = element_line(size = .1, color = "grey"),
    panel.grid.minor.x = element_line(size = .1, color = "grey"),
    plot.title = element_text(size = 25, hjust = 0.5, face = "bold", vjust = 1),
    plot.subtitle = element_text(size = 18, hjust = 0.5, face = "italic"),
    plot.caption = element_text(size = 8, hjust = 0.5, face = "italic", color = "grey"),
    plot.background = element_blank(),
    plot.margin = margin(2, 2, 2, 4, "cm")
  ) +
  transition_states(year, transition_length = 3, state_length = 1) +
  enter_drift(x_mod = -2) +
  exit_drift(x_mod = 2) +
  ease_aes("cubic-in") +
  view_follow(fixed_x = TRUE) +
  labs(
    title = "Tourist Arrival by country : {closest_state}",
    subtitle = "Top 10 Countries"
)animate(anim, fps = 10, width = 1000, height = 550)
anim_save("simulations.gif")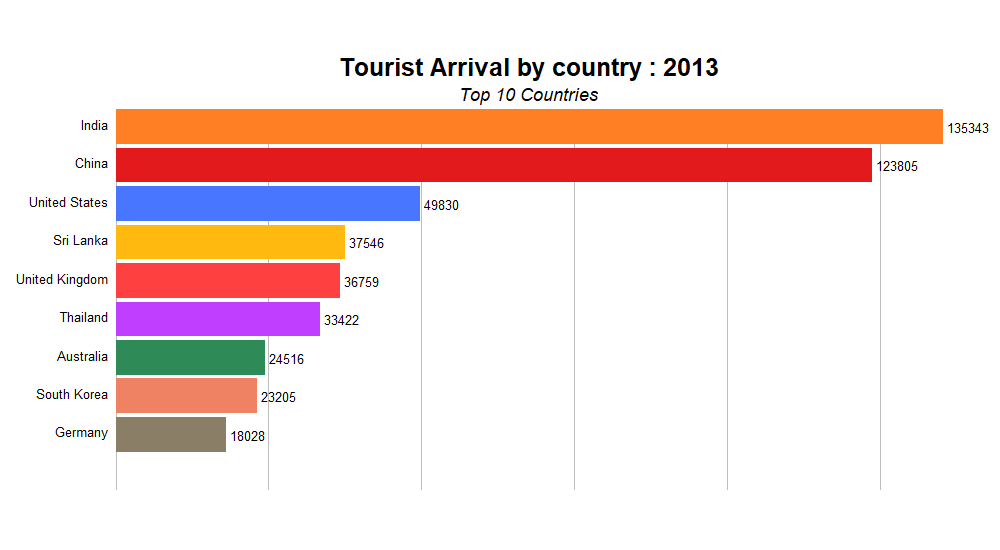
Conclusion
In this blog I showed the interactive visualization made with ggplot2 and plotly. I also made the animation showing the number of tourist arrival based on country from 2013 to 2017.
Reference
AbdulMajedRaja Rs. gganimate ggplot2